In the first installment of this series of articles on MICs (minimum inhibitory concentrations) we focused on what constitutes “true” or “real” MIC values. We saw that the vast majority of commercially automated ID and AST systems do not adhere to the International Organization for Standardization (ISO) 20776-1:2006 (E)1 or Clinical and Laboratory Standards Institute (CLSI) M07-A10 reference method MIC protocols. Manufacturers of automated systems are therefore required to generate clinical trial performance data to establish equivalence with the reference method. This constitutes supporting evidence that the MIC values they generate are “true” or “real”. In this article, we will explore the type of raw data collected by the VITEK® 2 and how this is converted into an accurate MIC value.
How is organism growth monitored?
Patient isolates are tested on VITEK® 2 using a single, self-contained, disposable AST card (Figure 1) per isolate. Each card contains at least one positive control well with no antibiotic (growth-promoting broth only) and multiple wells with increasing concentrations of various antibiotics in the broth.
VITEK® 2 continuously monitors growth in all wells. Growth in the positive control well is monitored until a pre-determined minimum amount of bacterial growth is detected through turbidity measurements (i.e. percent change of raw transmittance units – %ΔRTU). Growth in the control well shows that the test isolate is viable and growing at an appropriate rate to begin analysis of the various drug wells. This analysis continues every 15 minutes until the susceptibility test completes.
As Figure 2 shows, organism growth is measured in several ways in both the positive control well and the antibiotic wells. The relative growth of the organism in each antibiotic well is also compared to the growth in the positive control well(s).
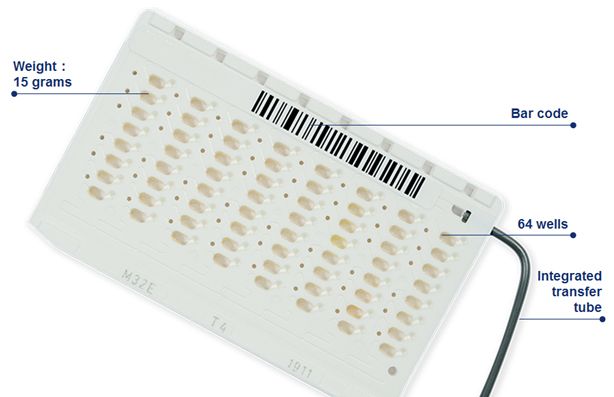
Figure 1: VITEK® 2 AST Card
Click to enlarge
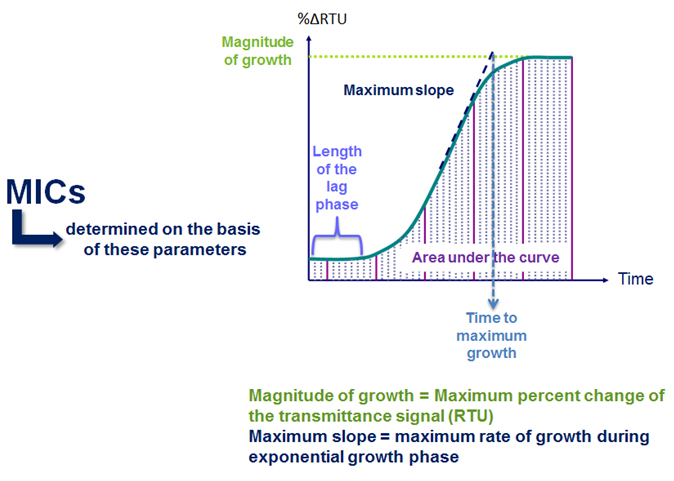
Figure 2: Principle of VITEK® 2 MICs
Click to enlarge
How is the MIC determined?
The MIC is determined by comparing the growth of the patient isolate to the growth of isolates with known MICs. It is like having a standard curve stored in the VITEK® 2, where the standard curve relates reference MICs to organism activity in the antibiotic wells.
It is important to note that the “standard curves” in VITEK® 2:
- Are multidimensional since VITEK® 2 is continuously looking at multiple parameters (as opposed to a single endpoint reading after overnight incubation)
- Were created using >1800 gram-negative organisms and >1200 gram-positive organisms with various resistance mechanisms
Because VITEK® 2 is continuously looking at growth over time and using multiple parameters to examine the growth (as opposed to a single endpoint reading after overnight incubation), it is not necessary to have a well for every MIC that can be reported. A single well is capable of providing information for more than one MIC because the organism activity in a well can be interpreted on a scale that is more informative than simply growth or no growth.
What is the value of continuous monitoring?
To illustrate the value of continuous monitoring of organism activity, let’s look at a VITEK® 2 AST test that can report doubling dilution MICs for an antibiotic concentration range of ≤ 0.25 μg/ml to ≥ 8 μg/ml. Graphs 1 through 6 illustrate the relationship between data generated by a VITEK® 2 system to results obtained by a reference method.
Each graph depicts the growth as observed by VITEK® 2 system for a particular organism with different reference MICs. One of the first observations from scanning the graphs is that we can interpret the growth activity in the various concentrations of antimicrobial more effectively than just stating growth or no growth. With just three concentrations, the VITEK® 2 can discern six unique growth patterns allowing it to report six different MICs.
Another key function of VITEK® 2 analysis is the ability to standardize data for a test organism by comparing the growth in each antimicrobial concentration to the growth in the control well. This step is essential to determine relative organism growth, since the shape of growth curves is different for different types of organisms. The length of the lag phase, the steepness of the change during the exponential phase, and the magnitude of the change during the exponential phase all contribute to giving an organism a unique set of growth characteristics.
To understand the data standardization process, look, for example, at the growth in the 0.5 μg/ml well compared to the growth in the growth control well in Graph 2. This organism has a reference MIC of 0.5 µg/ml. The growth in the 0.5 μg/ml is approximately 60% of that in the growth control well. In Graph 3however, the organism has a reference MIC of 1 µg/ml and the activity in the 0.5 μg/ml concentration is 95% of that in growth media alone. These percentages, or relative organism growth values are used by the VITEK® 2 to determine accurate MICs.
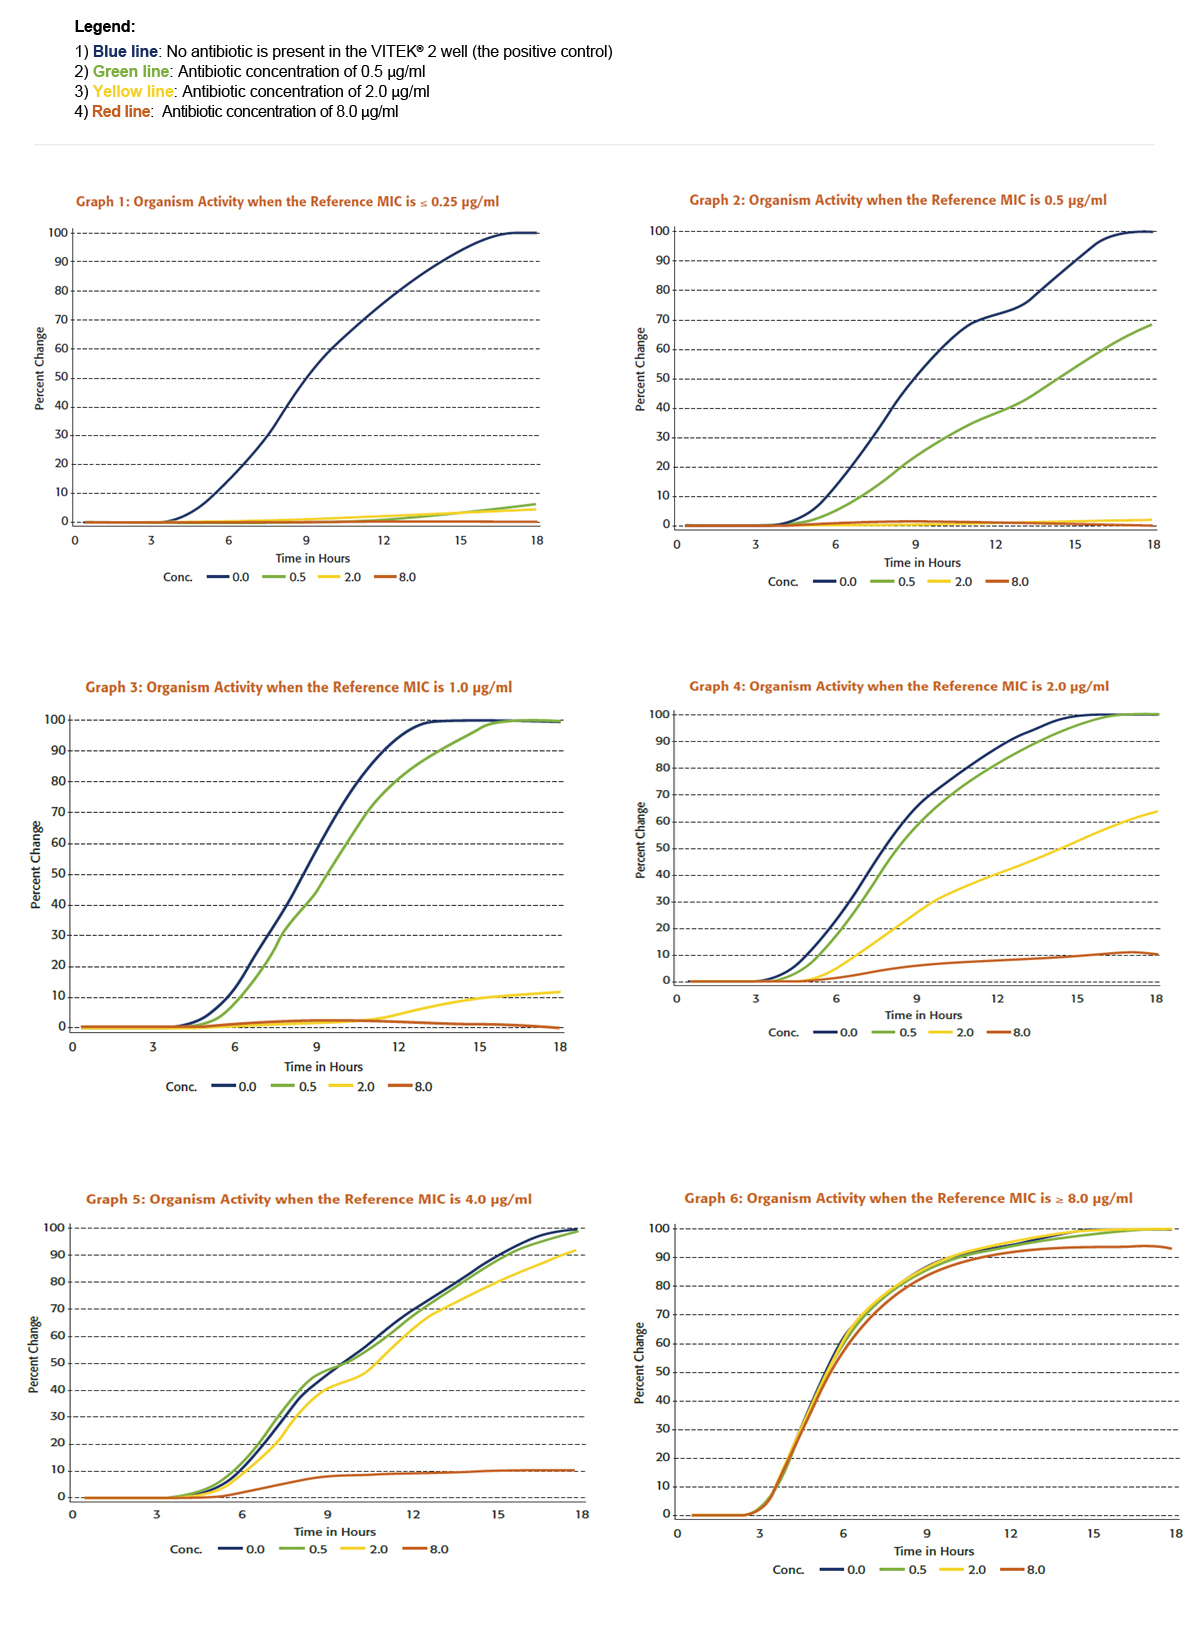
Graphs 1-6
Click to enlarge
For example, Table 1 below summarizes VITEK® 2 analysis of relative organism growth for the data in Graphs 1 to 6. It shows the numerical relationship between organism growth as determined by the VITEK® 2 and reference method MICs.
| Organism/Graph | Reference
MIC |
Antimicrobial Concentration | ||
| 0.5 | 2.0 | 8.0 | ||
| 1 | ≤ 0.25 | 3% | 2% | 1% |
| 2 | 0.5 | 60% | 3% | 1% |
| 3 | 1.0 | 90% | 8% | 2% |
| 4 | 2.0 | 95% | 50% | 8% |
| 5 | 4.0 | 99% | 92% | 9% |
| 6 | ≥ 8.0 | 100% | 100% | 99% |
Table 1: Relative Organism Growth in an antimicrobial well compared to the growth in the growth control well expressed as a percentage
- Each dimension represents the relative growth in one concentration of the antimicrobial
- Each diamond represents the point corresponding to the three relative organism growth values for a given organism
- The different color clusters represent a set of organisms with reference MICs ranging from ≤ 0.25 μg/ml to ≥ 8.0 μg/ml.
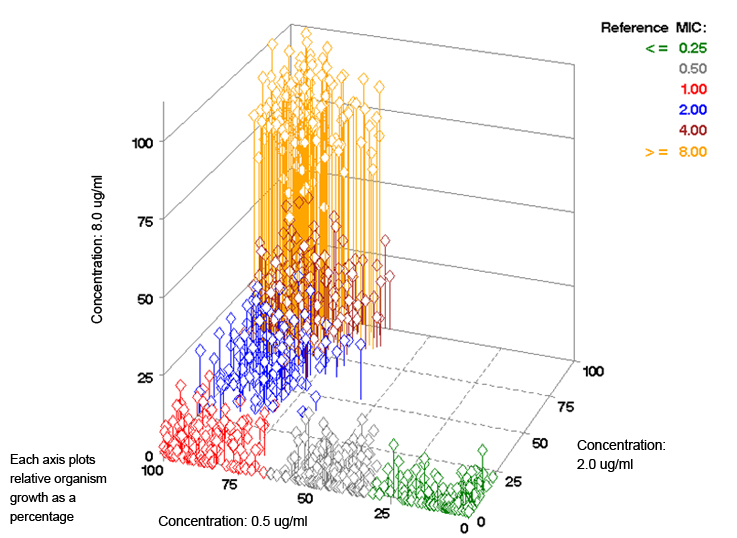
Plot 1: Relative Organism Growth Over a Large Set of Organisms
Each diamond represents a single organism
As an example, the diamond for the data corresponding to Table 1 – Graph 3 would be at the point (90%, 8%, 2%). The 90% would be plotted on the 0.5 μg/ml axis, the 8% on the 2.0 μg/ml axis, and the 2% on the 8.0 μg/ml axis. Since this organism has an MIC of 1.0 μg/ml, the color of the diamond would be red (based on the reference MIC color key provided in the upper right area of the plot). Overall, the three-dimensional plot illustrates the unique capability of the VITEK® 2 to differentiate between six different MICs with only three concentrations of an antimicrobial. Additionally, we see how determining the relative organism growth enables the VITEK® 2 system to account for the unique growth characteristics of each organism to determine the MIC.
Continuous monitoring of organism activity helps determine MICs as well as the incubation time required for an organism in the VITEK® 2 system. By knowing when an organism transitions from the lag phase to the exponential phase, the analysis software can determine the appropriate incubation time based on the growth displayed by each organism. Here’s how:
- At the end of the lag phase in the growth control well, the VITEK® 2 waits a predetermined amount of time
- The VITEK® 2 then checks if growth has occurred in the lowest concentration of antibiotic
- If growth is still occurring during this interval, the VITEK® 2 extends incubation for a further predetermined amount of time to assess the growth occurring in the remaining concentrations.
- This extension process continues until:
- no further significant growth has taken place, or
- until growth is seen in the highest concentration
Using this process, the VITEK® 2 has the capability to use a relatively short incubation time for most organisms since, in the end, it is the organism that dictates the length of incubation. The instrument simply adjusts as growth is detected. This has the added benefit of allowing detection of delayed resistance.
What’s the bottom line?
The VITEK® 2 approach to determine MICs breaks from tradition – but tradition is not the goal in science. On the contrary, we must always look for more efficient, effective and accurate ways to do things. VITEK® 2’s capacity to continuously monitor organism activity to pinpoint the length of incubation and determine the MIC is more rapid than traditional methods. During clinical trial evaluations, it has been demonstrated – repeatedly – that this process provides accurate and reproducible results.